Beirut explosion causes strong shock waves -
Infrasonic, hydroacoustic and seismic signals
registered and investigated by BGR
| REGION: | Beirut, Lebanon | DATE: | 04.08.2020 | SOURCE TIME: | 15:08:18 UTC | LATITUDE: | 33.90° N | LONGITUDE: | 35.51° E | SOURCE DEPTH: | 0 km | MAGNITUDE: | Mw = 3.5 (BGR) | |
Last modified: 19. March 2021 09:00 MEZ
A peer reviewed publication is also available at Scientific Reports:: https://doi.org/10.1038/s41598-021-93690-y
-------------------------------------------------------------------------------------------------------------------------------------------- Deutsche Zusammenfassung (German abstract)
Explosion in Beirut verursacht starke Schockwellen -
Infraschall, hydroakustische und seismische Signale
werden von der BGR registriert und untersucht
Stärke der Explosion in Beirut entsprach 1.100 Tonnen TNT
Die verheerende Explosion in Beirut (Libanon) am 4. August um 18:08 Uhr Lokalzeit, bei der mehr als 200 Menschen getötet und Tausende verletzt wurden, haben seismologische und Infraschall-Stationen im Umkreis von mehreren tausend Kilometern Entfernung registriert. Auch Stationen der Bundesanstalt für Geowissenschaften und Rohstoffe (BGR) empfingen die Signale. An Hand der vorliegenden Daten hat die BGR jetzt die Stärke der Explosion berechnet.
Nach offiziellen Mitteilungen sind bei dem Ereignis in Beirut etwa 2.750 Tonnen Ammoniumnitrat explodiert. Selbst auf Zypern hörten Menschen die Explosion. Der nicht-hörbare Schall der Explosion wurde sogar noch in mehr als 6.000 km Entfernung aufgezeichnet, ebenso an seismologischen und hydroakustischen Stationen im Umkreis von bis zu 400 km. Daten dieser Stationen wurden von der BGR analysiert, um die Signale der Explosion zuzuordnen und die Quellstärke abzuschätzen. Anhand der seismologischen Daten kann die Stärke der Erschütterungen nach Berechnungen der BGR mit einer Magnitude von 3,5 abgeschätzt werden. Für die Abschätzung der Sprengkraft der Explosion ist jedoch die Verwendung des Infraschalls besonders relevant. Hier ergibt sich auf Grundlage der Aufzeichnungen an den Stationen eine Ladungsmenge von bis zu 1.100 Tonnen TNT-äquivalent. Ein Wert, der mit den offiziellen libanesischen Meldungen übereinstimmt, da Ammoniumnitrat als Sprengstoff höchstens halb so wirksam ist wie TNT.
--------------------------------------------------------------------------------------------------------------------------------------------A huge explosion struck the city of Beirut, Lebanon on the 4th of August 2020 around 18:08 local time (15:08 UTC). It was most likely caused by the combustion of 2750 tons of ammonium nitrate stored in a harbor warehouse, as announced by the government shortly afterwards. The explosion led to thousands of casualties with more than two hundred fatalities. An enormous shock wave following the explosion caused immense damage to buildings and infrastructure, destroying houses, cars and windows all over the city.
The boom of the explosion was heard all over Lebanon and even reached Cyprus. The sub-audible analog of this shock wave was registered by infrasound sensors of the International Monitoring System (IMS) of the Comprehensive Nuclear-Test-Ban Treaty (CTBT), traveling through the atmosphere to distances up to more than 6000 km. Seismic and hydroacoustic signals from the explosion propagated through the solid earth and water and were recorded at nearby seismometers.
Data from regional seismometers (available via FDSN services from GEOFON and IRIS) and global IMS infrasound arrays (available to BGR as the German National Data Center of the CTBT) were analyzed by BGR to derive origin time and seismic magnitude and allow source localization as well as yield estimation.
Near-field source characterization using seismometers
Clear signals related to the explosion were registered at 16 seismic stations in distances of up to 400 km from the epicenter. The locations of these 16 stations are shown in Figure 1a. The 12 stations from networks GE, IS and KO are traditional surface seismometers, while the 4 stations from the network IM are so called ocean bottom seismometers, devices directly placed on the seabed. Waveform plots from these 16 stations are presented in Figure 1b. At all 12 surface stations (grey traces) a clear direct P-phase arrival can be observed at the theoretically predicted arrival time. These direct P-phase arrivals can also be observed weakly at the 4 ocean bottom sensors (blue traces). Instead of the direct P-phase arrivals hydroacoustic phases can be observed at the ocean bottom sensors. These hydroacoustic phases propagate in water from the the explosion site in Beirut harbor through the eastern Mediterranean Sea to the 4 ocean bottom seismometers south of Cyprus with phase speeds of approximately 1.5 km/s. Data from the 16 seismic stations can be used to obtain information about source time, epicenter of the explosion and strength of the event in terms of moment magnitude. Moment tensor inversions using the probabilistic source optimization algorithm Grond (included in the Pyrocko framework and obtainable from pyrocko.org) result in the following source parameters of the explosion:
| Source time: | 15:08:18.54 UTC (standard deviation 0.45 s) | Epicenter localization: | 33.9021° N, 35.5185° E (standard deviation 4.8 km) | Moment magnitude: | 3.5 (standard deviation 0.33) | |
For the full report please click here
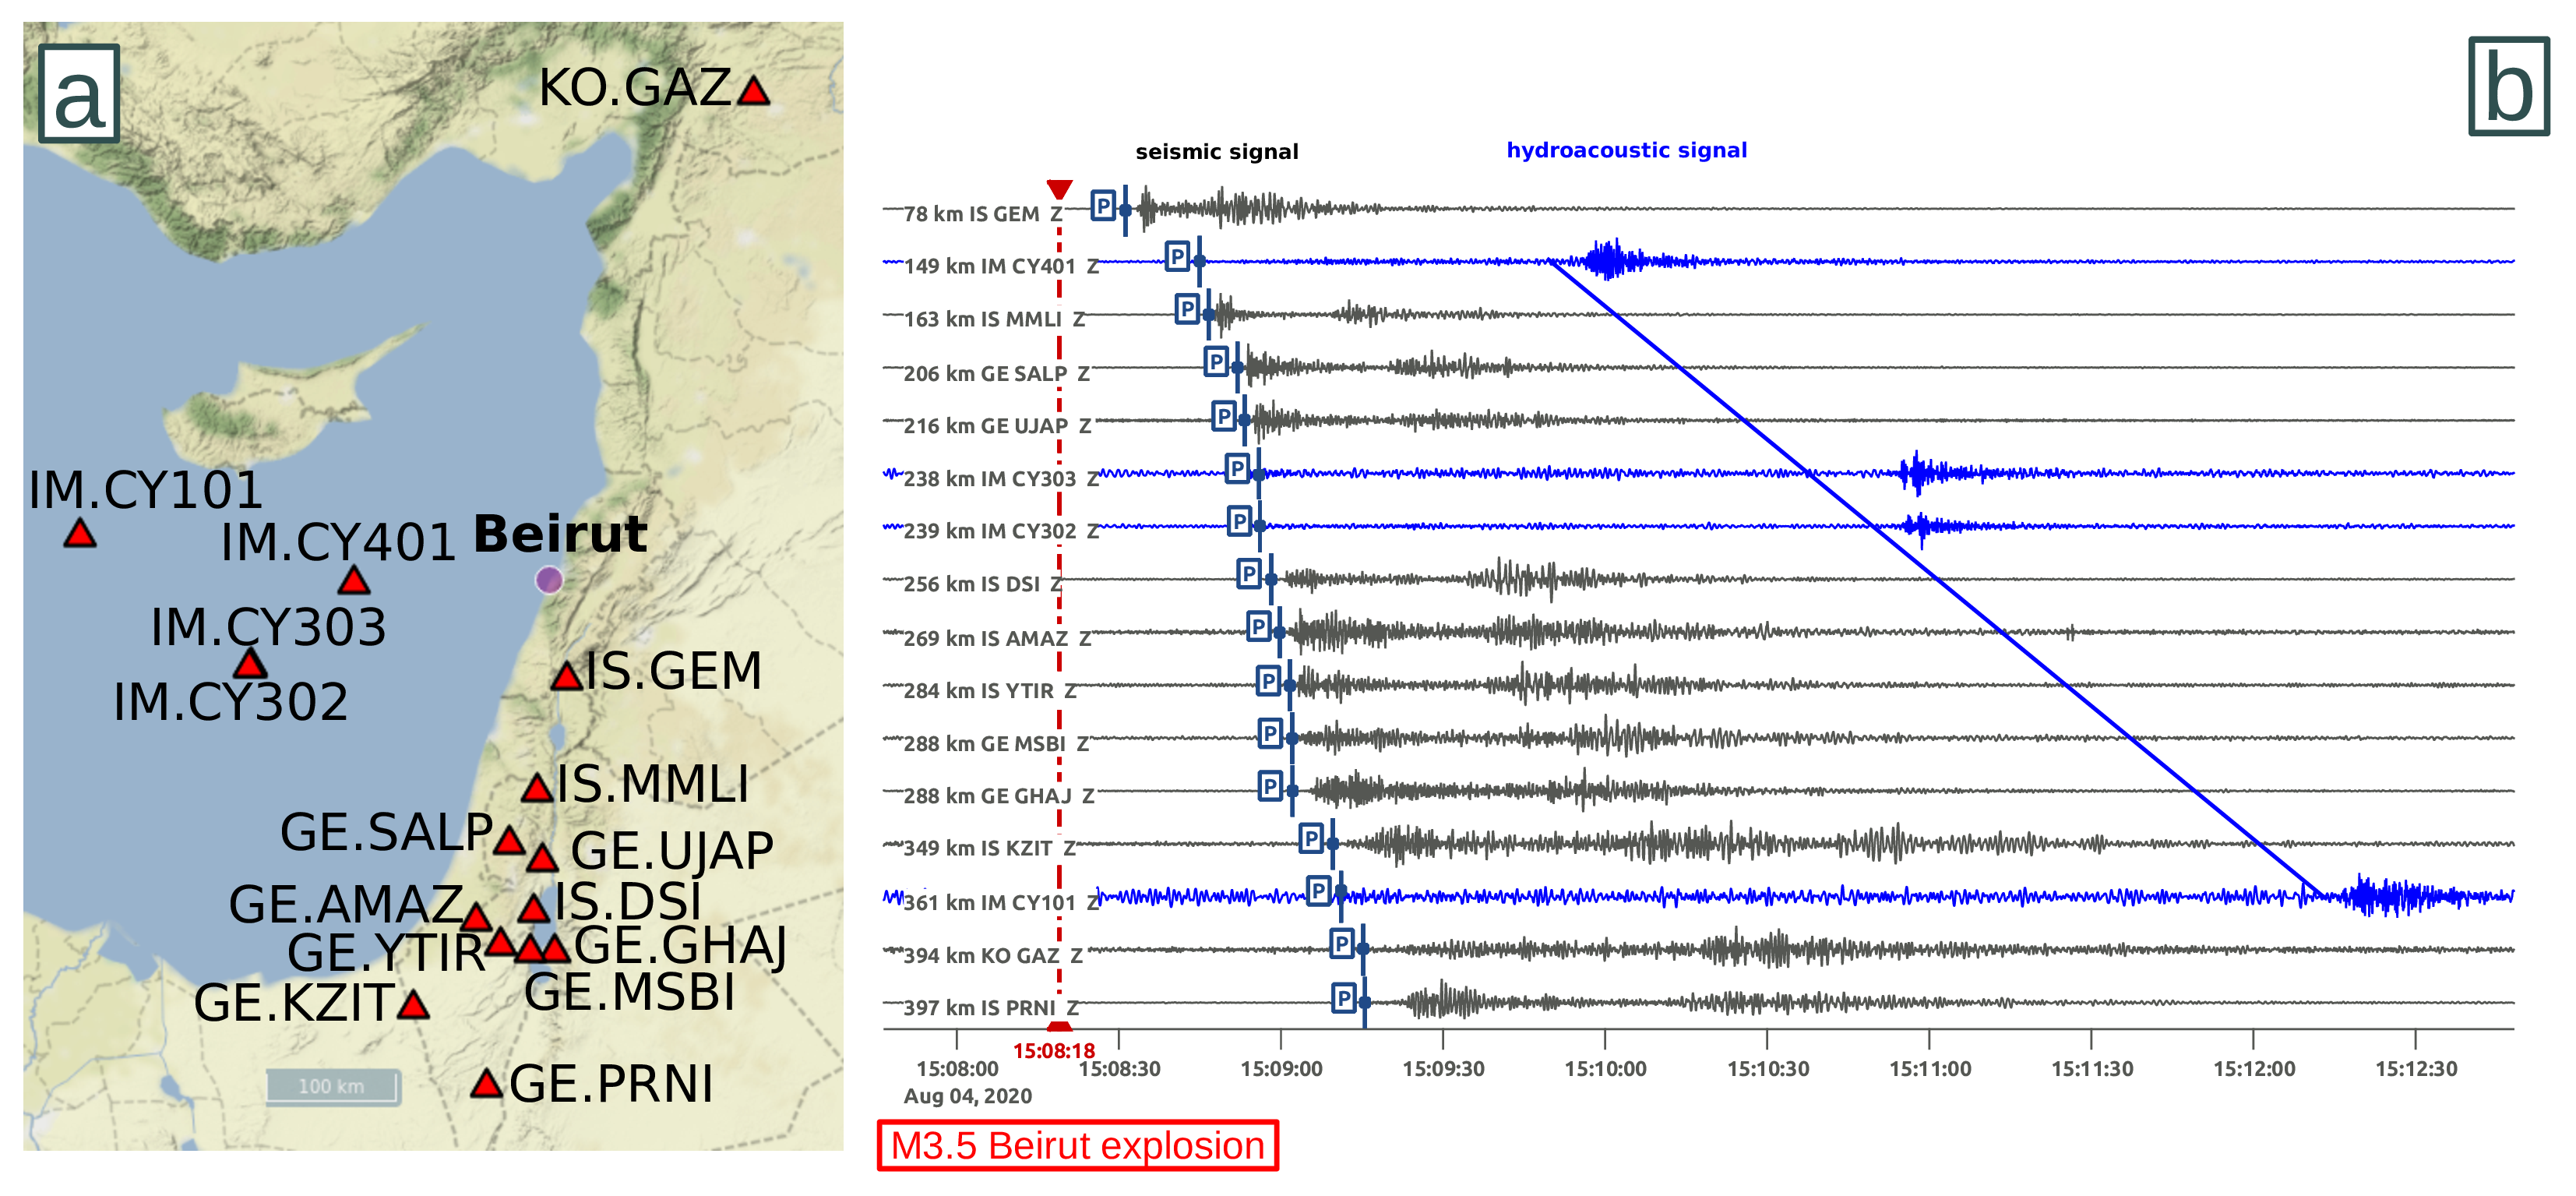
Figure 1: (a) Seismic stations within a radius of about 400 km from the explosion site. (b) Seismic waveform plots of the vertical component from the 16 stations shown in Figure 1a. The theoretical arrival of the direct P-wave at the stations is marked with P. Grey seismic traces represent surface seismometers, blue traces represent ocean bottom seismometers. Diagonal blue line marks the theoretical arrival time of hydroacoustic phases traveling through the eastern Mediterranean Sea with phase speeds of approximately 1.5 km/s. Source: BGR
Far-field source characterization using infrasound
Infrasound, which is sub-audible sound below the threshold of human hearing, propagates in atmospheric waveguides over large distances. Signals related to the Beirut explosion are recorded at five IMS infrasound arrays in distances up to more than 6000 km. The most clear and long-lasting signals are observed at the three stations I48TN (Tunisia, 2398 km distance), I26DE (Germany, 2450 km distance) and I17CI (Ivory Coast, 5129 km distance), which are presented in Figure 2. Azimuth and apparent sound speed information can be derived from the explosion signals for source localization using the Progressive Multi-Channel Correlation (PMCC) method. Furthermore, signal amplitude and signal period at maximum amplitude can be derived for yield estimation. An additional feature visible in the station recordings is the separation of the signal into various pressure pulses. These are not related to different explosions (only the largest eruption of the ammonium nitrate generating a strong shock is estimated to be observed at such large distances, not any precursory, smaller explosions) but to the separation of signal energy into different propagation paths. Infrasound propagates from the source to the receivers in a stratospheric waveguide, where signal energy is continuously reflected between the ground or sea surface and a region of the atmosphere with increased effective sound speed in about 50 km altitude. The explosion is also registered at two further IMS infrasound arrays (I42PT on Azores and I11CV on Kap Verde Islands), but with a lower signal content and higher parameter uncertainty. This is why those stations are used for localization but not yield estimation.
(a)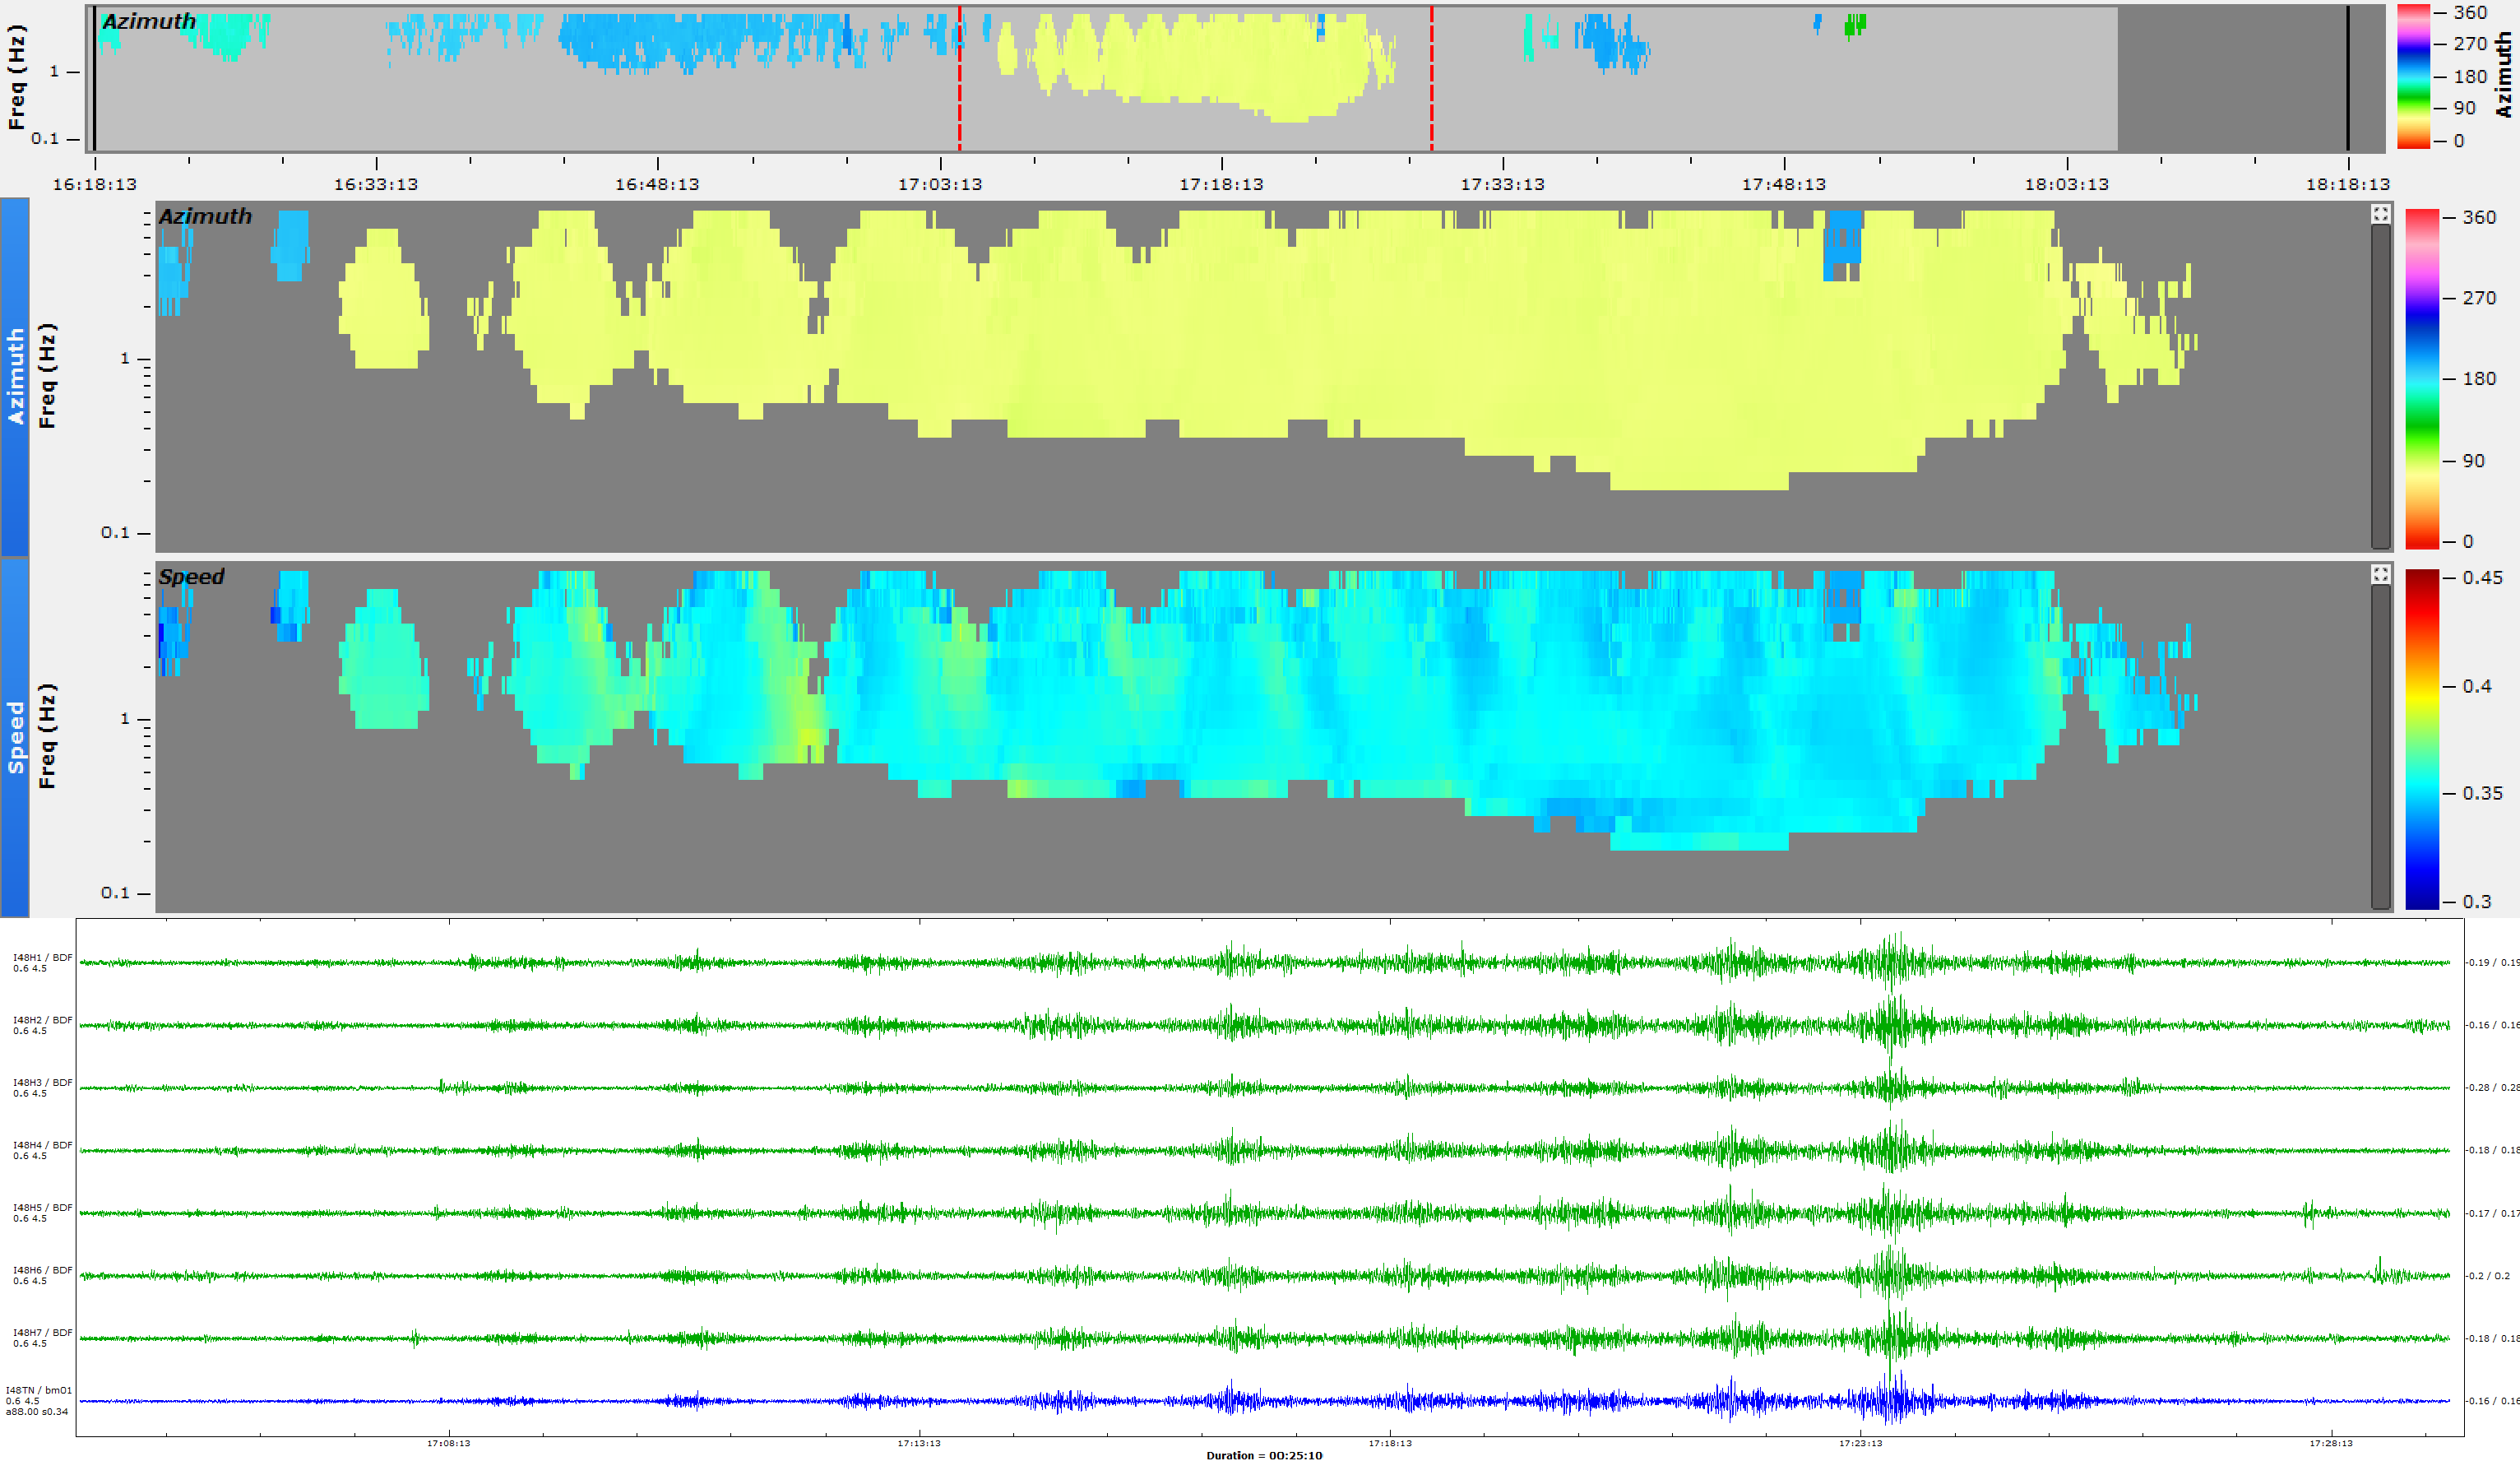
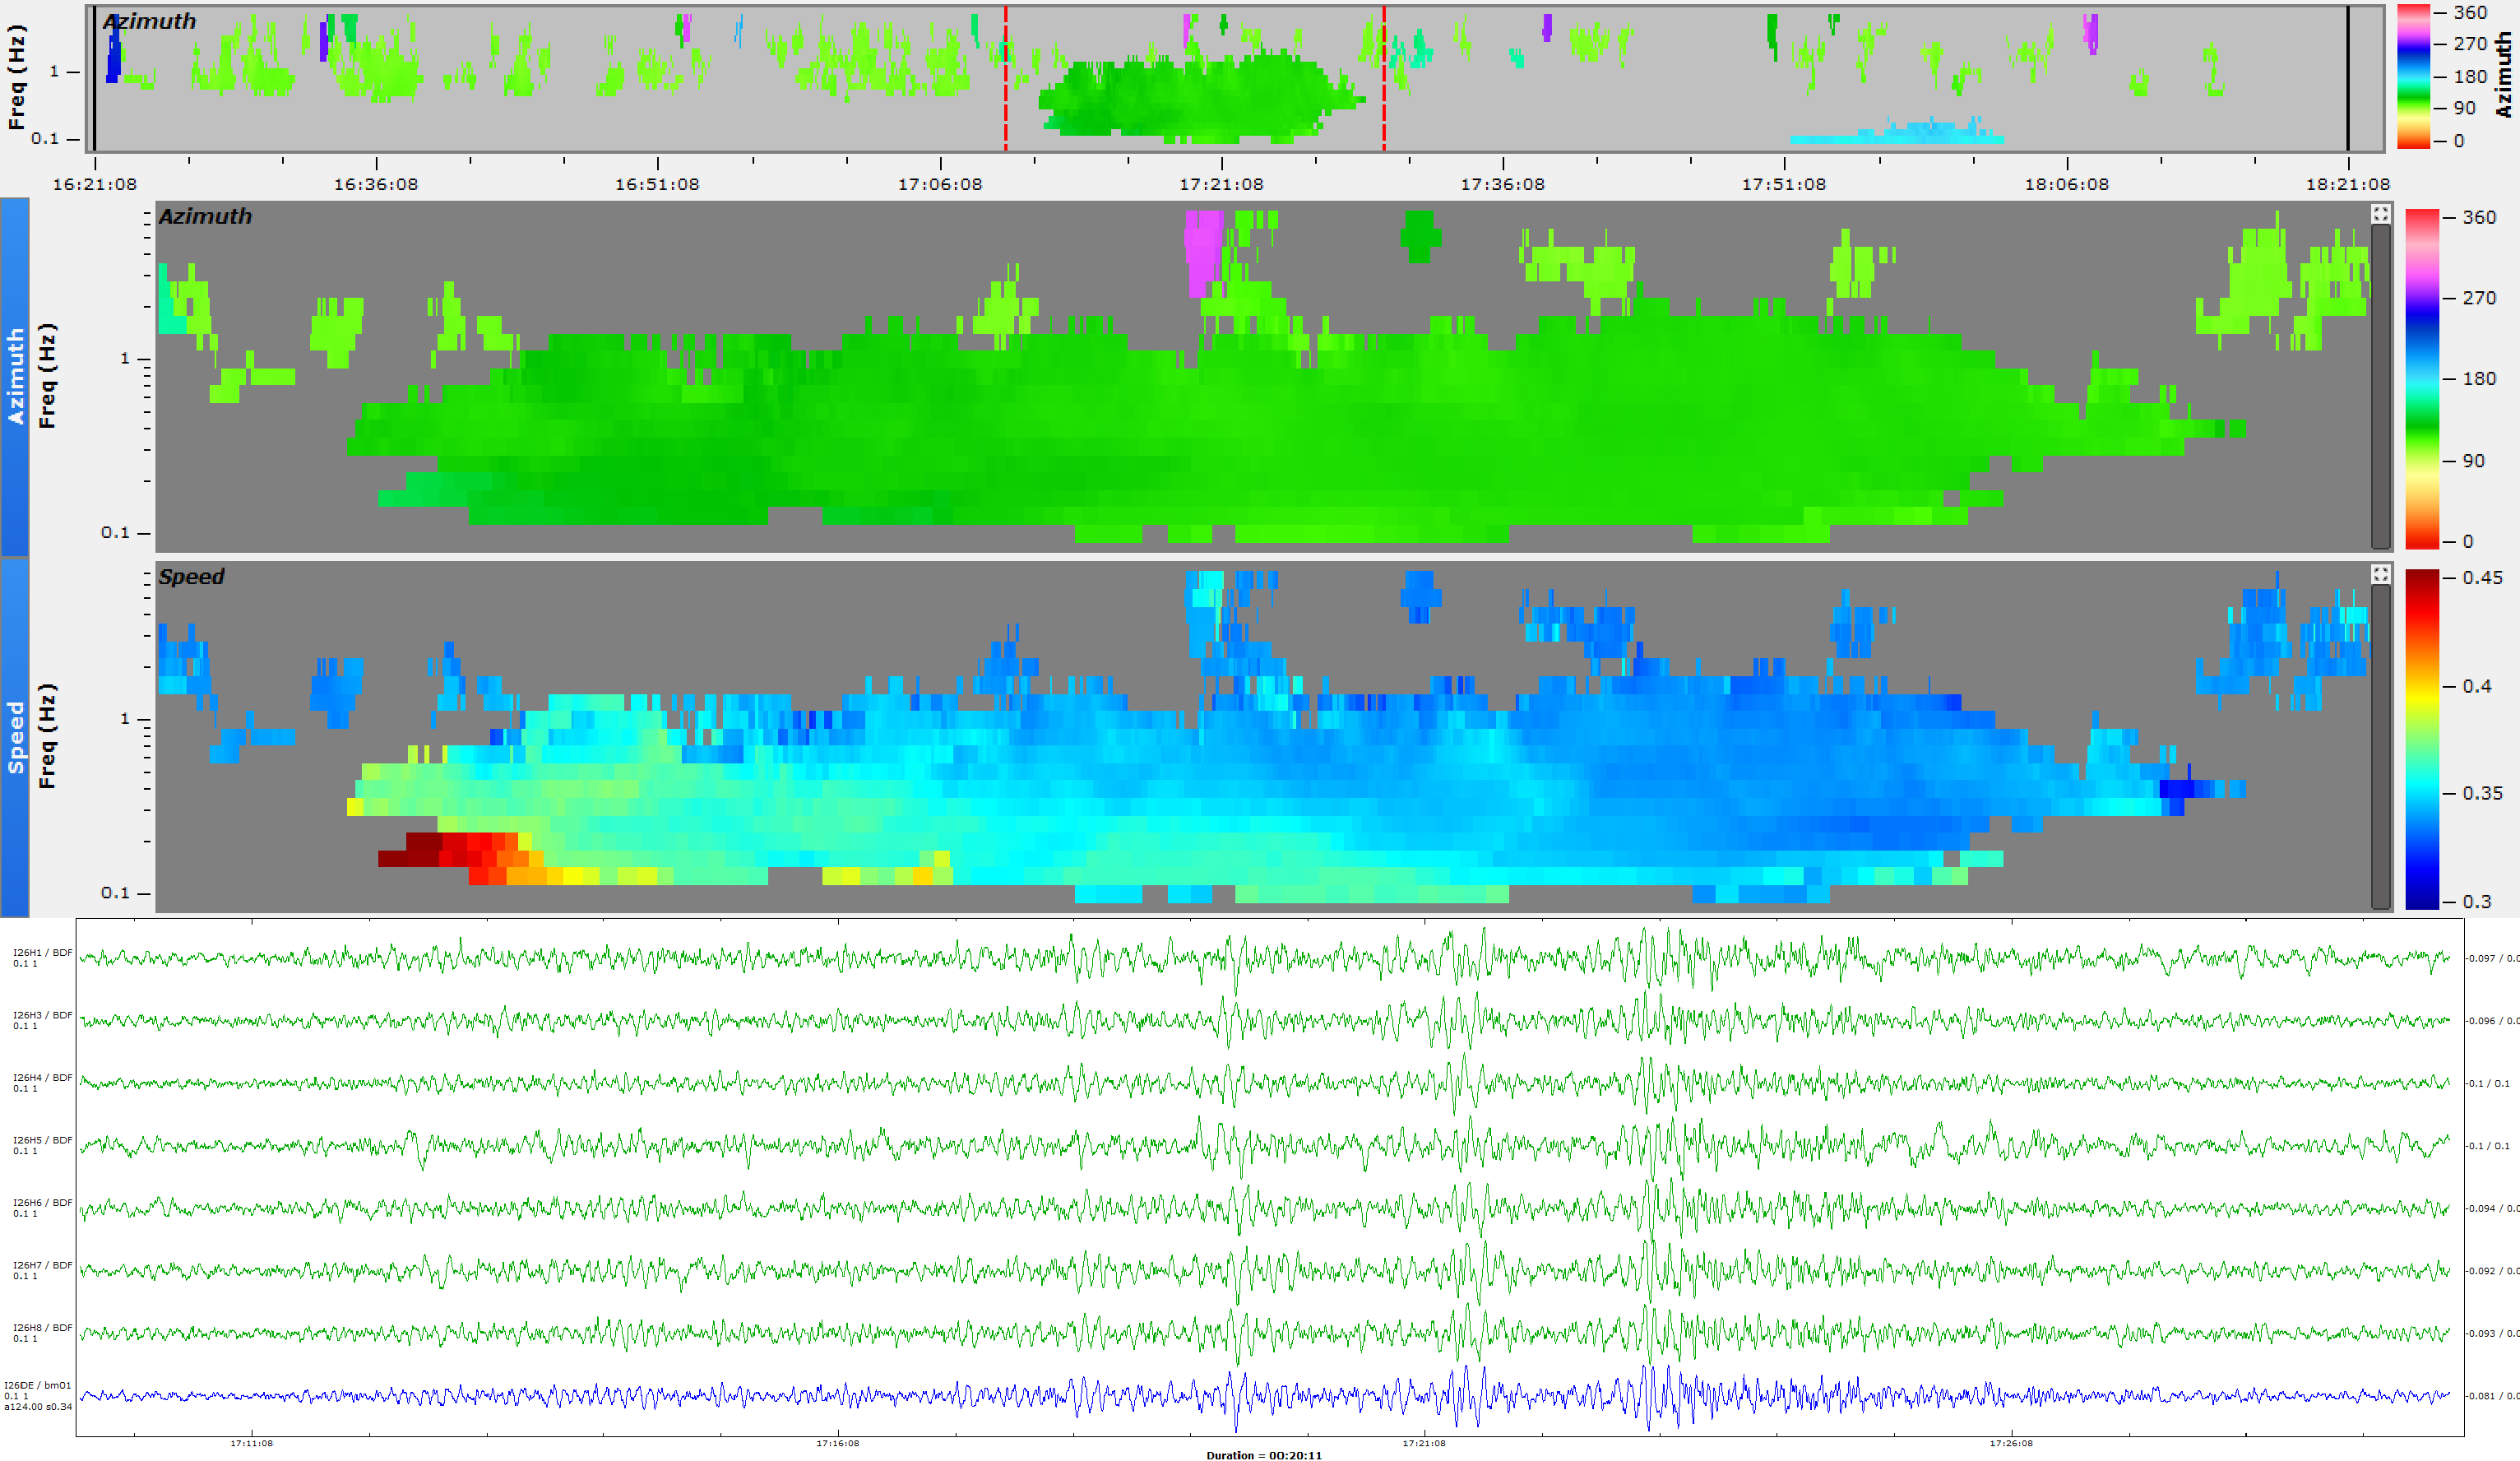
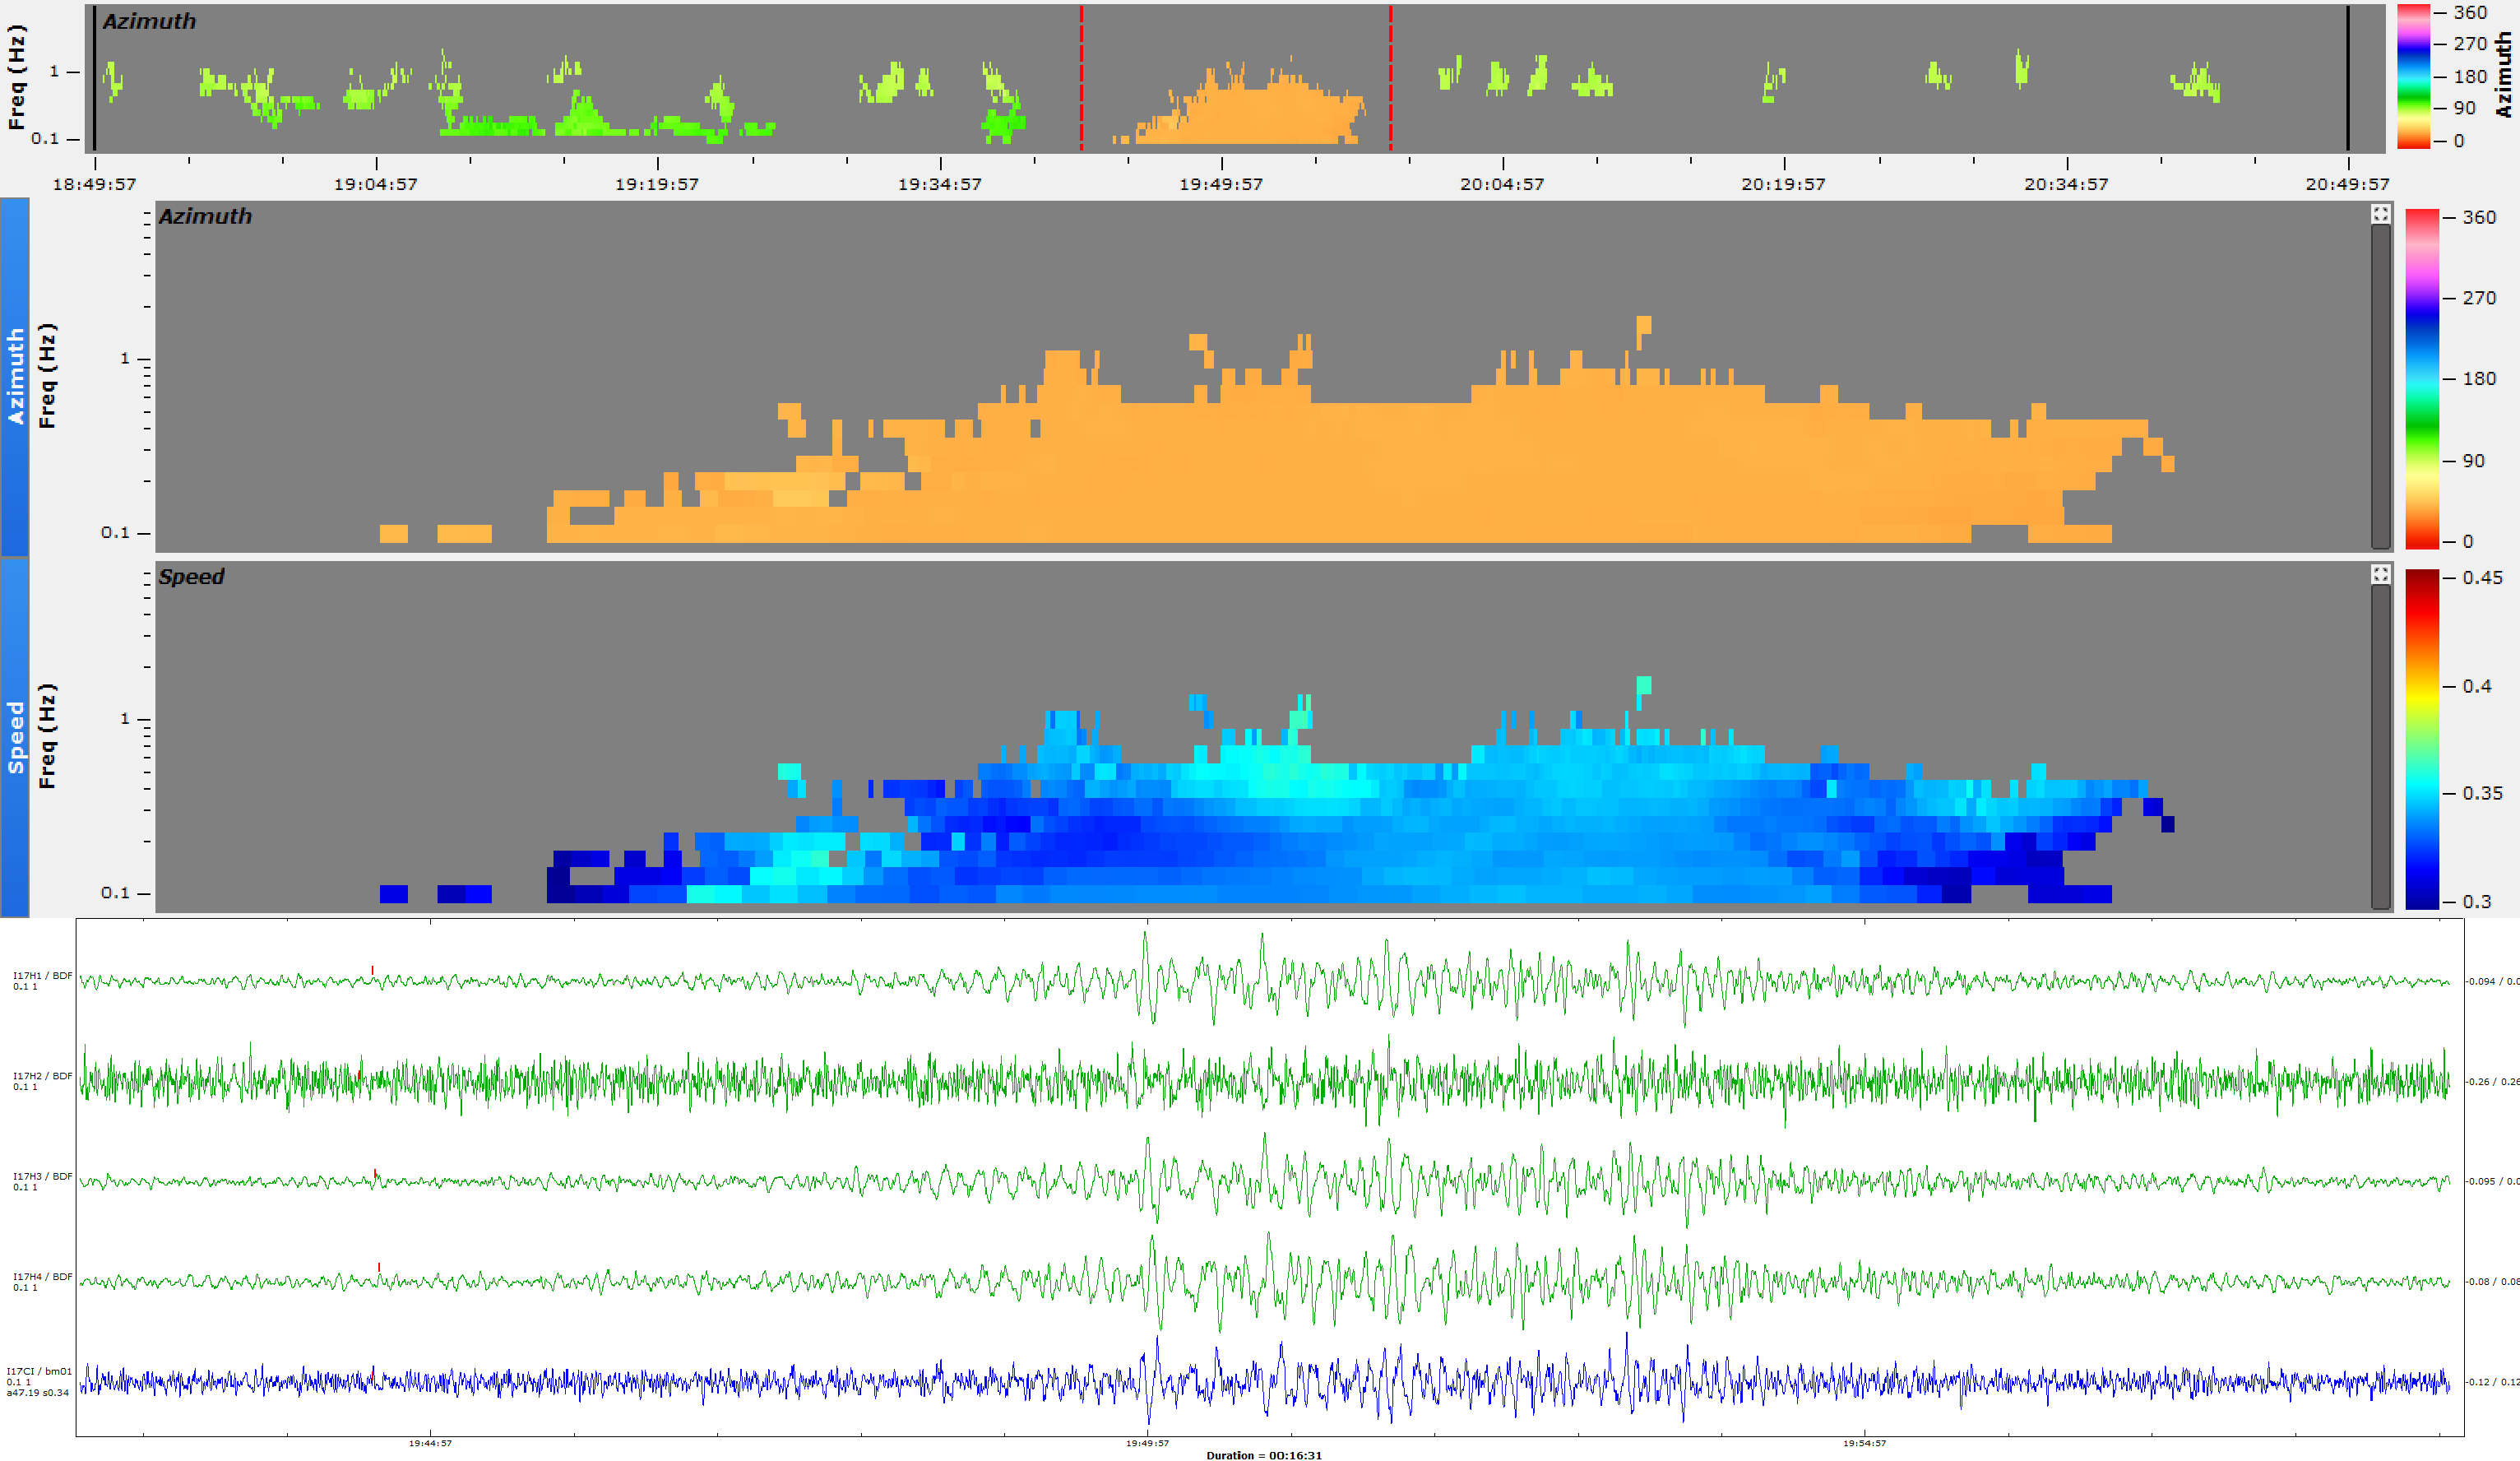
Figure 2: Infrasound analyses for the three stations (a) I48TN in Tunisia, (b) I26DE in Germany and (c) I17CI in Ivory Coast using the PMCC method. A time-frame of approximately 30 minutes is highlighted (dashed lines) in a 2 hour data segment around the expected arrival time of the explosion signal (upper frame). Shown are the PMCC derived azimuth and apparent sound speed values for each time-frequency-pixel (middle frames). Also shown (in the lower frame) are the raw pressure timeseries for each of the stations' microbarometers (green traces) and waveform beams towards to source (blue traces). Source: BGR
Source localization and yield estimation using infrasound
Infrasound recordings at different stations are useful for detecting and locating remote or undercover explosions worldwide. Despite the known origin of the devastating explosion in Beirut, this capability of the IMS infrasound network can be demonstrated using the PMCC results.
The cross-bearing approach relies on the triangulation of the mean PMCC azimuths that are associated with the event. The detected azimuths are projected along the great-circle propagation path (see Figure 3). The geographical center is determined from combining all two-station intersections. Here, the PMCC results were corrected by the atmospheric propagation conditions, based on a method applied by Pilger et al. (2018). The corrections were obtained using high-resolution analysis data of the European Centre for Medium-range Weather Forecasts (ECMWF) combined with climatological wind and temperature data. Taking all five stations detecting the event into account, the determined source location using infrasound differs from the actual one by only about 56 km south (33.4334°N, 35.3067°E) of the actual origin; whereas the localization is improved (33.5067°N, 35.4666°E) to only 44 km south of the actual origin when using only the three best detecting stations (I26DE, I48TN and I17CI, shown in Figure 2). Given the large distances of the stations and the uncertainty due to the along-path atmospheric conditions, this result impressively proves the capability of the IMS infrasound network for event localization:
| Event localization: | 33.5067°N, 35.4666°E (44 km south of Beirut) | |
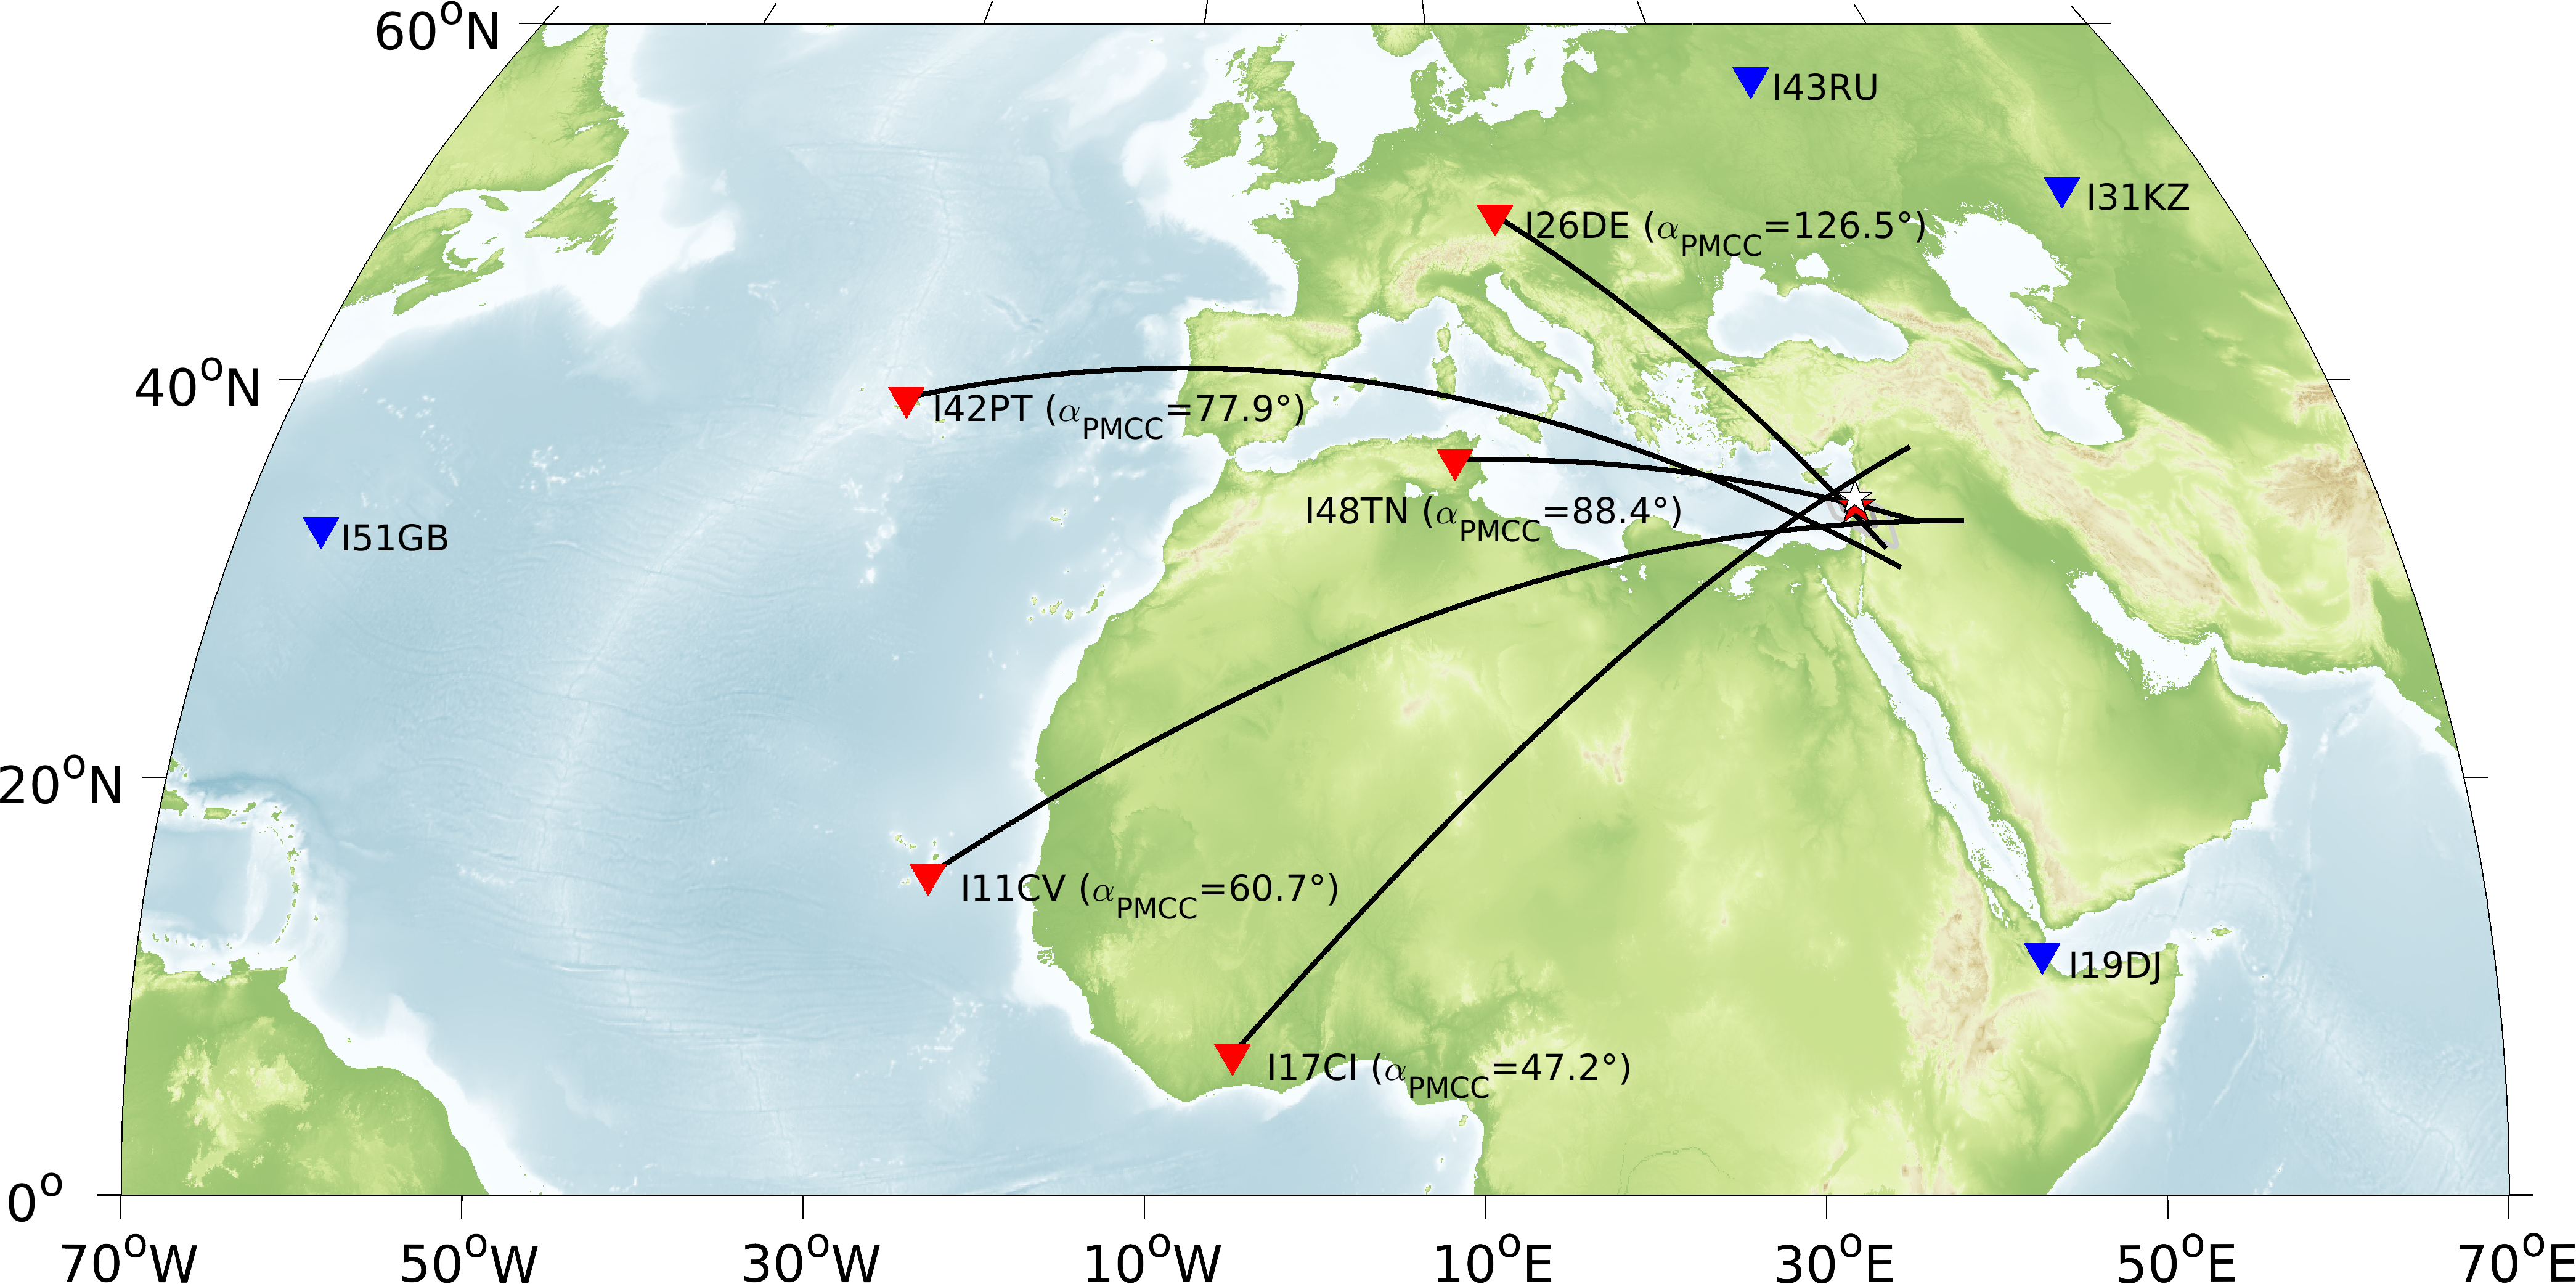
Figure 3: Cross-bearing approach for the locating the explosion using infrasound detections. This map shows all IMS infrasound stations (red triangles) that recorded signals of the explosion. The mean azimuth α as provided by PMCC is noted for each station. The black lines depict the great-circle propagation paths from the respective directions, corrected by the atmospheric propagation conditions using high-resolution analysis data of the European Centre for Medium-range Weather Forecasts (ECMWF). The red star depicts the determined source location, the grey contours indicate uncertainty levels. Source: BGR
Finally, the explosive yield can be derived from the PMCC analyses of the infrasound arrays that observed the explosive event. Information from the three stations shown in Figure 2 are used to estimate the explosive yield by two different methods. The first method solely depends on the dominant signal period at maximum amplitude. It is based on the AFTAC (Air Force Technical Application Center) relation by ReVelle (1997). The second method depends on source receiver distances and wind corrected amplitude measurements, thus also incorporating ECMWF-derived stratospheric wind profile information. It is based on the LANL (Los Alamos National Laboratory) relation by Whitaker (2003). Applying both methods to values derived from the three IMS infrasound arrays, an average explosive yield can be estimated as follows:
| Explosive yield: | 0.5 - 1.1 kT TNT equivalent | |
This is in good agreement with the announced amount of 2.75 kT ammonium nitrate being the source of the explosion and having an explosive efficiency of about 30-50% of TNT.
Overall, this tragic and devastating event has accidentally demonstrated the capability of the IMS for verification of the compliance with the CTBT. A surface explosion in the order of ~1 kt TNT equivalent has been detected at least at 5 IMS infrasound arrays allowing to reliably locate and characterize such an event.
Further information: http://www.bgr.bund.de
contact 1: Dr. Christoph Pilger, phone: 0511 - 643 2878, email: christoph.pilger@bgr.de
contact 2: Seismologist on duty, phone: 0170 - 2357564 (Hotline, daily 08:30 - 16:30 local time), email: seisinfo@bgr.de